

Better React Performance - useCallback vs useMemo
This post was originally published on FreeCodeCamp.
We all want to build powerful applications and avoid unnecessary renders. For that you should know that there are some hooks available to help you but it is common to have wrong information about when and which one to use.
Through this article you will learn the differences of useCallback and useMemo as well as how to measure the gain of the improvements you are introducing in the code base.
Before we begin, it is important to note that the following methods for optimising React are really last resort options, as before you even think about applying these utilities your own code will offer you more improvement points than most of the performance gain you would get just by using what you will learn here.
Still, it's important to know the tools and know when to use them if you see the opportunity.
Resources
- Official Beta Documentation for useCallback and useMemo
- Example Project Source Code
- Example Project Live Demo
As always, a sample project is provided to test in a simplified environment everything that is explained here. No big deal, the example project is just a summary of the main points you will learn now.
Before we start comparing these two hooks, let's review some necessary background concepts.
Referential Equality
When React compares the values used in a dependency array such as useEffect, useCallback, or props passed to a child component it uses Object.is().
You can find the detailed explanation of Object.is but in short:
- Primitive values are equal (check the link above for the few exceptions).
- Non-primitive values refer to the same object in memory.
In a simplified example:
"string" === "string" // true
0 === 0 // true
true === true // true
{} === {} // false
[] === [] // false

const f = () => () => 'Hi'
const f1 = f()
const f2 = f()

f1 === f1 // true
f1 === f2 // false
React.memo
A brief explanation of React.memo which will be mentioned later in the article and can also be considered as a method to improve performance.
When you want to avoid unnecessary re-renders on a child component even if the parent component changes, is to wrap the whole component with React.memo and as long as the props do not change, note referential equality here too, the child component will not be re-rendered.
import { memo } from 'react';

const ChildComponent = (props) => {
  // ...
}

export default memo(ChildComponent)
Now you know the necessary previous knowledge, let's start.
useCallback
One of the built-in hooks we can use to optimise our code but as you'll see it's not really a hook for direct performance reasons. In short useCallback will allow you to save the function definition between component renders.
import { useCallback } from "react"

const params = useCallback(() => {
		// ...
    return breed
  }, [breed])
The usage is pretty straightforward:
- Import
useCallbackfrom React because it is a built-in hook. - Wrap a function that you want to save the definition.
- As in
useEffectpass in an array of dependencies that will tell React when this stored value (the function definition in this case) needs to be refreshed.
One of the first things to note is precisely the function definition part. Stores the definition, not the execution itself, not the result, so the function will be executed every time it is called, this hook is not intended to avoid lengthy calculations.
So what is the advantage of storing a function definition?
Referential Equality
If the function itself is used, not the returned value, such as:
- Dependency on
useEffector any other hook. - Prop of a child component, context, etc.
To achieve true equality between renders, useCallback will store the function definition with the same reference to the object in memory.
Without this hook, in each render the function will be recreated and point to a different in-memory reference, so React will understand that it is different even if you use React.memo in your child component.
In the example project you can test this behaviour and see that with the non-optimised version every time you write, the side effect of a child component is triggered. In that demo, you only get a fetch and a fake slowdown, but imagine this same problem in a large project that runs expensive computations on the client or spends a lot on the server.

useMemo
The second built-in hook you will see today, in this case you can consider this hook as a direct optimisation because it stores the result of a function and prevents it from being executed again until the dependencies change.
As it can store the result of a function and also prevent execution between renders of a component you can use this hook in two situations.
Referential Equality
As you saw with useCallback we can achieve referential equality with this hook as well but this time for the result itself. If a function returns something that is going to be treated differently in each render, most common, objects and arrays, you can use useMemo to get true equality.
import { useMemo } from "react"

const params = useMemo(() => {
    // ...
    return { breed }
  }, [breed])
In the example above you can see the use of useMemo:
- Import
useMemofrom React because it is a built-in hook. - Wrap a function that you want to save the result.
- As in
useEffectit passes an array of dependencies that will tell React when this stored value (the value returned by the function) needs to be refreshed.
In this case, the function returns an object, as you know comparing objects with Object.is are not the same because they are stored in different memory addresses, with useMemo you can save the same reference.
In the example project you can test this behaviour as in the previous section, same results too, with the non-optimised version each keystroke will retrieve the images, with useMemo the equality is maintained and the child component does not retrieve the image again.

Expensive Calculation
Because you are storing a value and avoiding executing the function at all with useMemo you can use this to avoid executing unnecessary expensive calculations and be more performant.
Let's see this with the example project:
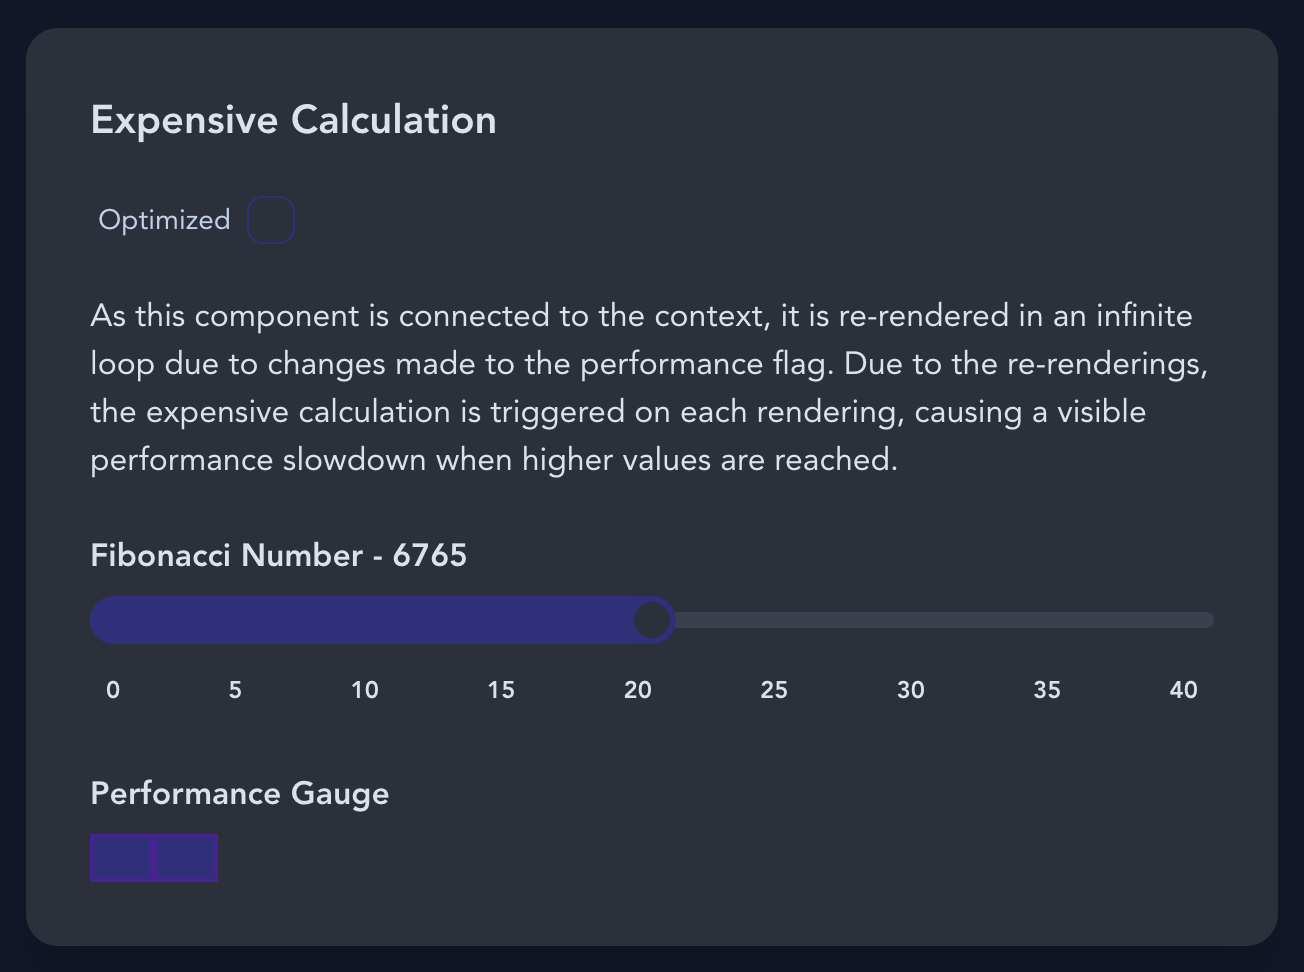
There is a component which, given a number n, prints out the nth Fibonacci number, this recursive version of the algorithm is rather poorly performing.
You will also find a constant change over time to force renders, the performance gauge will change state (adding and removing blocks 60 times per second). Because this state is changing all the time, the function that calculates the fibonacci number is constantly running over and over again, even the given number is always the same.
With this, you will see how the performance degrades visibly when you use higher values with the non-optimised version. The optimised version will only suffer performance spikes when you change the numbers in the slider (when the number changes) but the rest of the renders will skip the calculation and directly serve the result.
The problem here is that in our day to day work we will not encounter calculations called "expensive calculation" and the decision of when to use useMemo cannot be always or never.
When to optimise
So far you have seen some indicators on when to use the different hooks to avoid unnecessary rendering and/or side effects but let's define some general rules for deciding when to use them in those not so clear cases:
- Review your code first and rethink how you've structured things, in your own code are the biggest opportunities to improve performance of all. More information on this post by Dan Abramov.
- If you don't have proof that an optimisation is giving you beneficial results, don't optimise, it's not free.
- If you don't want to do the extra work involved in proving that an optimisation is giving you beneficial results, let's be honest, you don't want to optimise either.
How to measure performance impact/gain
The most important rule for optimisation, always after reviewing your own code first, is to be able to measure whether the changes are taking effect and what the % gain is. And not only in order to be able to throw that % in your next performance review.
For this we are going to look at two options on how to proceed when you suspect there is a performance problem or simply want to check the main areas of improvement.
Clunky version
I'll put this option because let's face it, you keep debugging your code with console.log all over the place, don't you? Don't worry, we are in the same boat.

A fast and furious approach to trying to measure performance problems is to find out how long it takes to execute a certain action and how many times that action is performed, so one way to do this is:
const t0 = performance.now()
expensiveCalculation(targetNumber)
const t1 = performance.now()
console.log(`Call to expensiveCalculation took ${t1 - t0} milliseconds.`)
console.count('Expensive Calculation')
But this information alone will detect very few and obvious cases where you already suspected something was wrong. Also be careful with the StrictMode which will trick your console.count by repeating some renders for stability reasons.
Let's check the right way to do it.
Pro version
In this version you will use the official React Developer Tools to inspect the performance of certain parts of your code. Once this browser extension is installed, open the browser's developer tools and search for Profiler.
I will give examples with the sample project but you can do it with your own project and check the results.
If you press the record button and start performing the actions that you think might need some performance tuning, the profiler will save and print a detailed explanation of what has happened there.
For example, in the expensive calculation example project we are going to compare side by side the non-optimised version versus the useMemo version:
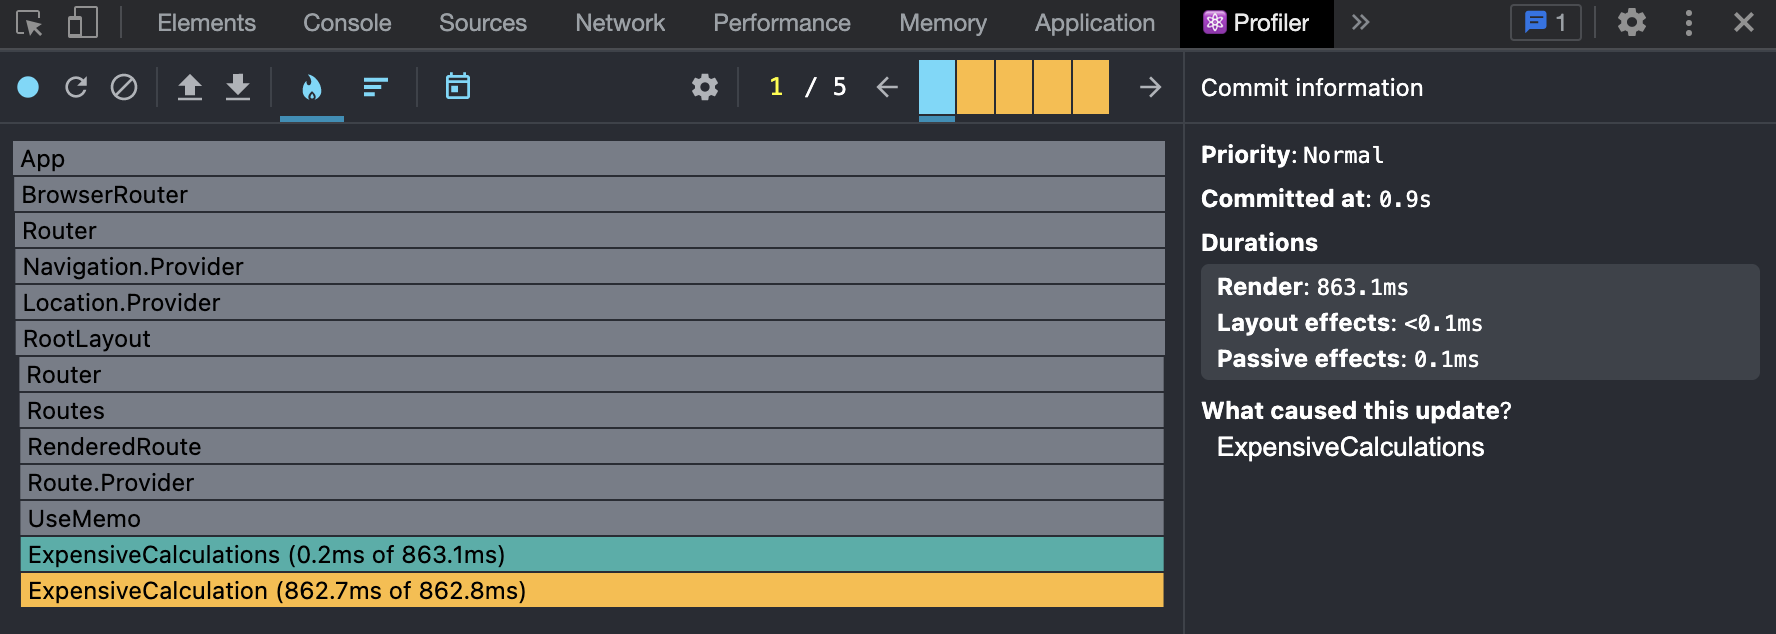
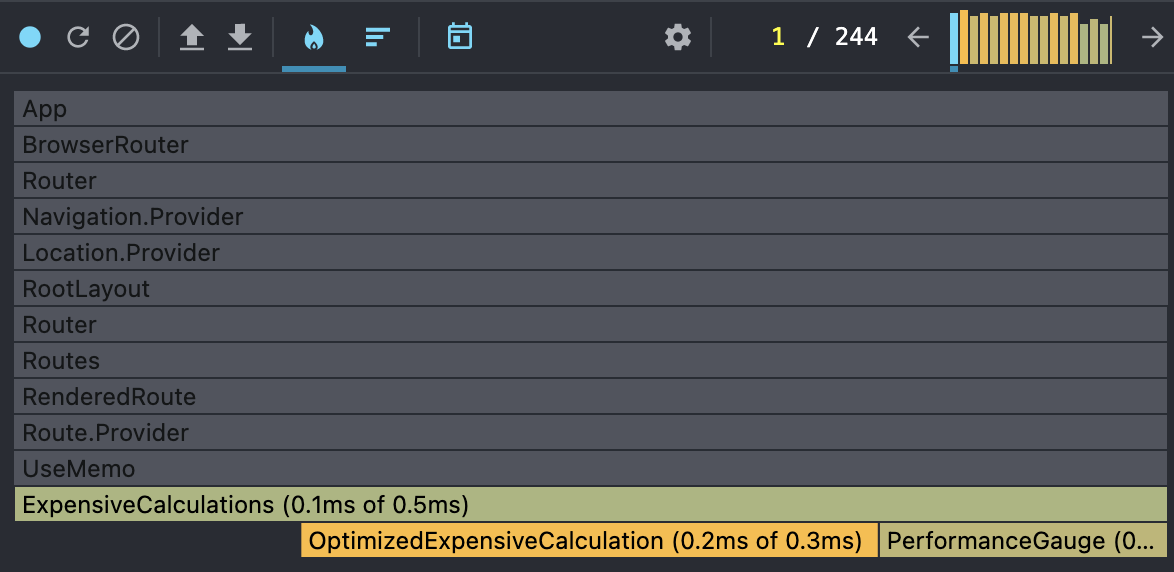
I pressed the record button, waited a few seconds and pressed record again to get these results, with both versions. As you can see, as this is a prepared extreme case, the huge improvement between the two is evident.
But let's take a closer look at what appears in the profiler:
- The grey rows are components that have not been re-rendered so it is nothing to worry about in terms of performance.
- The green and yellow rows are components that have been re-rendered and you can see how long it took to render.
- If you click on each block, you can see a detailed explanation with more data.
I will do a full in-depth article on profiler, but for now here are some quick tips:
- Under the settings icon, General, check
Highlight updates when components render., this will show what exactly is being rendered and can detect child components that are not meant to render under certain actions. - Under the settings icon, Profiler, check
Record why each component rendered while profiling., this will add a brief explanation of what a component is rendering and that may give you clues as to where you need to place an upgrade.
Conclusion
As you have seen, these two common misunderstood hooks have very different functions and scenarios on where to use them for real benefit. Now is the time to review some of your current/past projects and spot the cases where you were using this incorrectly or others that may need it.
Optimisation in React is something that in the future can be done automatically by the library but, at the time of writing this article, it is a process that you should do with care and a good analysis.
I hope you found it useful and it will help you to build better performing applications with React, thanks for reading!